Publishing reports
Contents
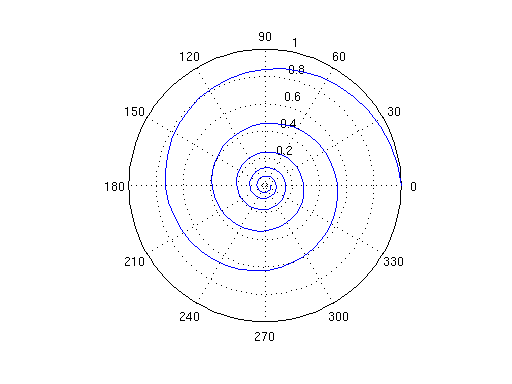
a spiral plot
let's plot a spiral given by r(t) = exp(-theta/10), 0<=theta<=10*pi
Creat theta and r
theta = linspace(0,10*pi,200); % fill theta
r=exp(-theta/10);
Now plot using polar theta vs r
polar(theta,r)

sin(pi/2)
ans =

     1